
Amin Terouhid, Ph.D., CVS
Maryam Mirhadi, Ph.D., VMA
Executive takeaway. A Function Analysis System Technique (FAST) diagram is a function-logic model used in value engineering (VE). It shows why project functions are needed and how they are achieved. By testing those relationships within a defined study scope, FAST separates needs from proposed solutions and opens the discussion to alternatives.
Start with functions, not components
SAVE International’s Function Analysis Guide presents FAST diagramming technique and relationship validation as tools for organizing functions, while Value Analysis Canada describes FAST as a way to identify missing, duplicated, or unnecessary functions. [1] [2] A function states what a project or system must do. In standard VE practice, the team describes it with an active verb and a measurable noun. The verb states the required action; the noun identifies what receives the action and what the team can evaluate.
This language keeps the analysis focused on need. For example, “install roof drain” is an activity and “roof drain” is a component; both point toward a particular solution. By contrast, “collect water” states the required result without prescribing equipment. Examples of properly worded functions include “control runoff,” “transfer loads,” and “convey passengers.” Measurable means the team can establish performance criteria—requirements used to judge how well the function is performed. [3]
Test the How/Why logic
FAST arranges functions according to function logic: the reasoned relationship between required actions, not the sequence of construction. Moving left to right, the team asks, “How is this function achieved?” The answer is a lower-order function, a more specific action. Moving right to left, it asks, “Why is this function needed?” The answer is a higher-order function, a broader purpose. Reading both ways helps expose unsupported assumptions and missing functions. [2]
The main horizontal chain is commonly called the FAST critical path. Here, the term means the principal How/Why path through the function model. It is not the critical path in a Critical Path Method (CPM) schedule, which identifies the sequence of activities controlling project duration. FAST contains no activity durations, dates, or schedule float. The team identifies the functions by asking, “When this function occurs, what else must occur?” In FAST, When expresses a supporting relationship, not clock time.
Use scope lines to focus the study
Scope lines are vertical boundaries defining the part of the function model the VE team will examine. A higher-order function may remain outside the left boundary because it explains the project purpose but is not open to change. A lower-order function may remain outside the right boundary because the logic continues beyond the selected subject. Within the scope, the basic function is the studied system’s principal purpose. Classification depends on scope; a function may be basic in one study and secondary in another.
Hypothetical example: a building roof-drainage system
Assumptions: The study concerns a conventional building roof within a defined property boundary. The illustration is a simplified function model, not a final design.
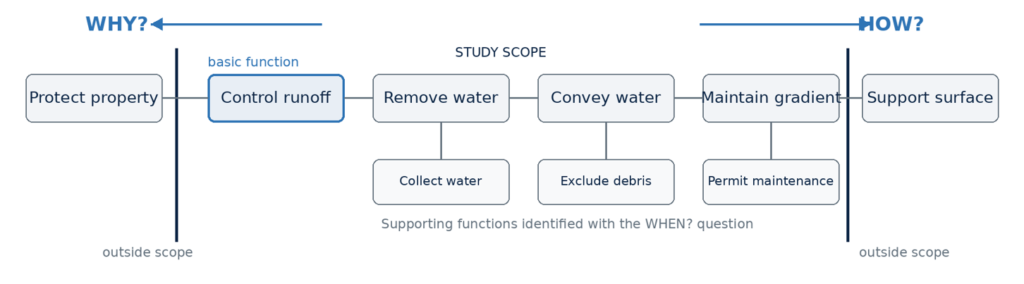
Figure 1. Simplified FAST model for roof drainage
Arrows label the questions; the connecting lines represent logical relationships, not workflow or elapsed time
Reading left to right, the owner protects property by controlling runoff; runoff is controlled by removing water, conveying it, and maintaining the gradient that enables movement. Reading right to left tests why each function exists. The supporting functions, collect water, exclude debris, and permit maintenance, may be essential even though they are not on the main path.
Because the model avoids naming roof drains, downspouts, pipes, scuppers, or detention tanks, the team can compare different ways to perform the functions. Performance criteria may include flow capacity, reliability, maintainability, code compliance, site constraints, and water-quality objectives. Resources include money, materials, labor, energy, and time. Comparing performance with the resources required over design, construction, operation, maintenance, renewal, and disposal connects the discussion to life-cycle value—the value delivered over the system’s useful life—rather than initial cost alone.
Common mistakes that reduce the diagram’s value
Teams sometimes replace functions with components (“roof drain”), specifications (“six-inch pipe”), or activities (“install piping”). Others arrange the boxes in installation order, turning FAST into a process flowchart or CPM schedule. Additional mistakes include leaving scope lines undefined, treating When as elapsed time, accepting logic that works in only one direction, combining competing solutions in one function model, and adding so much detail that the central relationships disappear. A useful FAST model remains implementation-free: it defines required actions without committing the team to a particular component or design solution. [4]
The facilitator’s role and the owner’s next steps
A FAST facilitator is the neutral process leader who guides the analysis without selecting the design. The facilitator draws out functions from knowledgeable participants, challenges solution-oriented wording, tests How/Why logic in both directions, and records disagreements and assumptions. The diagram is a shared model that the technical team validates against project requirements and available evidence, not an answer imposed by the facilitator.
As a professional recommendation, owners should define the study scope and performance criteria before diagramming; involve people who understand design, construction, operations, and maintenance; test every principal-path relationship in both directions; record unresolved assumptions; and use the agreed functions to organize the creative, evaluation, development, and recommendation phases of the VE study. FHWA’s VE Job Plan likewise places function analysis before creative and evaluation work. That sequence reinforces the central point: FAST is successful when it improves the alternatives and decisions that follow. [3]
References
[1] SAVE International. Function Analysis Guide.
[2] Value Analysis Canada. Function Analysis System Technique (FAST).
[3] Federal Highway Administration. The Value Engineering Process and Job Plan.
[4] Borza, J. S. FAST Diagrams: The Foundation for Creating Effective Function Models (2011).