
Amin Terouhid, Ph.D., CVS
Maryam Mirhadi, Ph.D., VMA
Executive Summary
Function Analysis System Technique (FAST) diagramming provides a structured, objective, and easy way to document the functions of a project or system, which can be used to evaluate those functions and identify value-enhancing opportunities in value engineering (VE) studies. By visually mapping the logical “How-Why” dependencies between project components, FAST separates basic functions from other functions, such as secondary or all-the-time functions, which enables project teams to eliminate unnecessary costs without eroding functional integrity.
1. Introduction to Function Analysis System Technique (FAST)
Developed by Charles Bytheway in 1964 and refined through SAVE International standards, FAST is the foundation of structured Value Engineering (VE). Unlike traditional budgeting tools that organize costs by trade or material divisions (e.g., concrete, HVAC, electrical), FAST organizes a project by its functional objectives expressed in standard verb-noun pairs.
2. The Standard FAST Diagram Logic Structure
A FAST diagram structures project functions horizontally and vertically along a logical grid bounded by the Scope Lines.
|
Dimension / Axis |
Direction |
Governing Question |
Primary Purpose
|
|
Horizontal Axis |
Left to Right |
HOW? |
Establishes the logical sequence of functions required to achieve the Higher Order Function. |
|
Horizontal Axis |
Right to Left |
WHY? |
Validates necessity; moving left answers why a function on the right is performed. |
|
Vertical Axis |
Top / Bottom |
WHEN? / IF? |
Captures concurrent, supporting, or aesthetic functions (e.g., “Assure Safety”, “Enhance Appearance”). |
An excerpt from a FAST Diagram prepared for a highway project is shown in Figure 1.
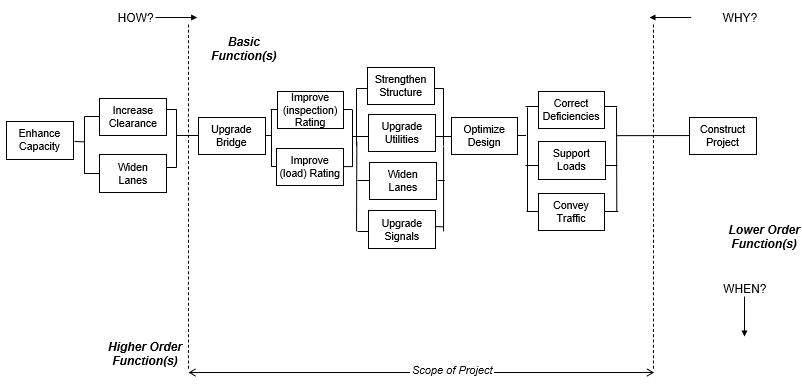
Figure 1: FAST Diagram Example (Highway Project)
3. Understanding the FAST Diagram Flow (Figure 1 Analysis)
Figure 1 illustrates how a complex infrastructure project is broken down into logical dependencies bounded by project scope lines. Outside the left scope line sits the Higher Order Function (Enhance Capacity), representing the ultimate objective of the overall program. The core of the diagram contains the Basic Function (Upgrade Bridge), which is essential to achieving the project’s purpose. Moving left to right along the horizontal axis, reading with the question “HOW?”, shows the stepped progression required: to Enhance Capacity, we must Increase Clearance and Widen Lanes, which requires us to Upgrade Bridge, and so on through design optimization down to the Lower Order Function (Construct Project) outside the right scope line. Conversely, reading from right to left answers “WHY?” each function exists. Functions branching vertically address “WHEN?” or “IF?” secondary and supporting functions—such as utility upgrades or signal improvements, —must take place concurrently, allowing the Value Engineering team to evaluate whether each component directly supports the critical path or represents an unnecessary cost add-on.
4. Key Steps in Developing a FAST Diagram
Creating an effective FAST diagram requires a disciplined, step-by-step approach that transitions project team members away from material-focused thinking toward functional clarity. By systematically defining and mapping each function, multidisciplinary teams can uncover redundancies, optimize cost distribution, and streamline project scope without sacrificing performance.
- Step 1: Identify Functions (Verb-Noun Pairs): Classify all system components into two-word functional definitions (e.g., “Support Load”, “Protect Enclosure”, “Control Light”).
- Step 2: Establish the Critical Path: Determine the Basic Function that directly satisfies the user’s primary requirement, then map the dependent functions left-to-right.
- Step 3: Define Scope Boundaries: Set the Left Scope Line (input/higher-order goal) and Right Scope Line (input requirement or boundary condition) to focus the analysis.
- Step 4: Map Supporting & Concurrent Functions: Place secondary, aesthetic, and safety functions vertically relative to the critical path.
- Step 5: Allocate Costs to Functions: Map project expenditure directly to the functional blocks rather than material quantities to reveal cost-to-value imbalances.
5. Strategic Benefits of FAST Diagramming
The implementation of FAST diagramming yields significant advantages over traditional cost-cutting approaches by establishing a shared visual language across all engineering disciplines. Rather than arbitrarily slashing high-cost line items, teams gain a transparent overview of how every dollar spent connects directly to functional performance and owner value.
- Objective Value Alignment: Shifts stakeholder discussions from material preferences to functional necessity.
- Prevention of “Value Stripping”: Protects vital performance metrics by exposing the structural consequences of removing key elements.
- Enhanced Multidisciplinary Collaboration: Connects architects, engineers, contractors, and owners around a shared visual logic map.
- Optimized Cost Allocation: Reallocates budget from low-value aesthetic or redundant functions toward high-impact core operations.
Conclusion
FAST diagramming transforms Value Engineering from a reactive cost-reduction exercise into a proactive design optimization framework. By systematically mapping functional dependencies, project leaders can leverage the capabilities of FAST Diagramming to evaluate those functions and identify value-enhancing opportunities in value engineering (VE) studies.