
Dr. Maryam Mirhadi, PMP, PSP
Introduction
The terms cost flow and cash flow are often used interchangeably. It is important, however, to identify the purposes that each of these tools intends to serve. These diagrams are among the important elements of financial analysis prior to the commencement of and over the course of a project. Well-prepared cost and cash flow diagrams should be evaluated before making financial decisions concerning a project.
Definitions
A cost flow diagram is a graph that shows expenditures over time. This diagram shows the budgeted amount of money that is needed over time to make progress as planned. Cash flow, however, provides a pictorial representation of income over time. This diagram illustrates how much income the project is going to earn or how much fund will be allocated to the project over the course of a project. A cash flow diagram provides the estimated sums of money to which a project or a project party has access over time.
In its definition of cash flow, AACE International combines the two aforementioned diagrams. Per the AACE International’s Cost Engineering Terminology (Recommended Practice No. 10S-90), cash flow is a “time-based record of income and expenditures, often presented graphically”, and it shows “inflow and outflow of funds within a project”. A combined view of cash and cost flow illustrates the amount and timing of cash inflows and outflow.
Each of the diagrams discussed above can be prepared from the perspective of different project parties involved in implementing a project. For example, a project cash flow that is prepared from the perspective of an owner may represent how the project is funded from the perspective of an owner but a cash flow prepared from the perspective of a contractor may represent a time-based record of income that the contractor is expected to receive for its particular scope of work.
Benefits
The diagrams discussed above are among the important elements of financial analysis that can be performed prior to the commencement of and over the course of a project. Well-prepared cost and cash flow diagrams should be evaluated before making financial decisions concerning a project.
Prior to the commencement of a project, cost and cash flow diagrams are used to assess the financial justifiability of a project. Once candidate projects are identified, decision makers use cash and cost flow diagrams to decide whether or not a project should be pursued. In project-based organizations that implement a portfolio of projects, these decisions are made to determine if a project can be added to the organization’s portfolio of projects. Capital budgeting methods such as net present value (NPV), payback period, and internal rate of return (IRR) are used to make such decisions.
Over the course of a project, cash and cost flow diagrams can be used to adjust project schedules. If a project team determines that adequate monetary resources are not available to make progress according to the plans, it may decide to postpone some activities to ensure enough funds will be available to be spent when needed. Conversely, if higher-than-expected monetary resources become available during specific periods of time, a project team may decide to ramp up its efforts to benefit from the flexibility that higher-than-expected levels of monetary resources have afforded. For example, if a project-based organization determines that funds will not be available to be allocated to a project, the organization may decide to remove some resources from the project and postpone some activities.
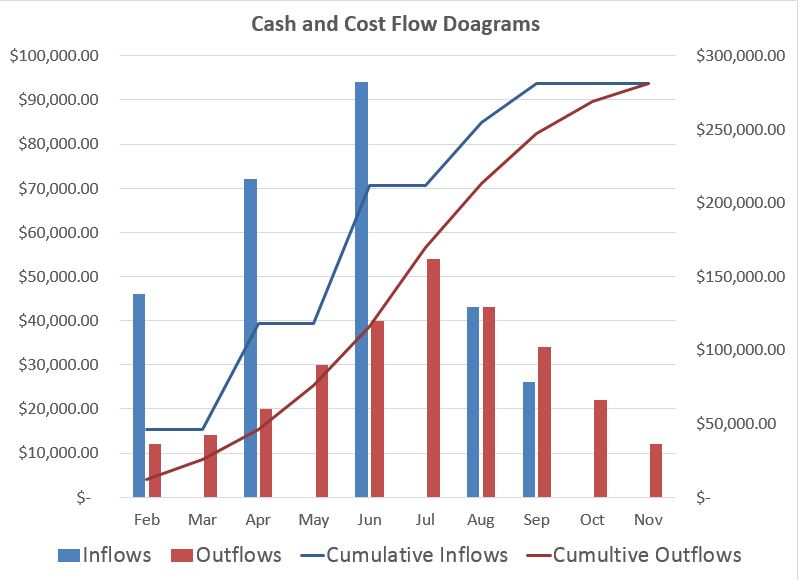
Making a comparison between the cumulative cash and cost flows can also be insightful to identify if adequate monetary resources will be available to fund the project based on its needs. The following figure shows an example of a comparative analysis of cash and cost flow diagram. As this figure indicates, the cumulative cash flow diagram should always represent greater values than the values represented by a cumulative cost flow diagram. A cumulative cash flow diagram that takes values less than the values represented by a cost flow diagram represents insufficiency of funds during certain time periods identifiable by the visual inspection of the diagram.
Assessing the project cost flow can also have other benefits. This analysis can help analyze excessive costs and overruns by comparing the budgeted (i.e., time-phased estimates) cost of performing the changed work with the sums of money originally needed to make progress according to the plans. This assessment can help identify the adverse effect of the change on the resource costs needed over time.
This assessment can be insightful only if the cost flow and estimates are prepared at a sufficiently detailed level. Otherwise, they cannot provide an insight into the impact of change because of the lack of granularity of the pricing data available. Properly documenting the basis of estimates and using proper cost breakdown structures are two other important considerations in budget and cost flow documentation. Detailed budgets or cost flows are prepared by relying on certain assumptions and information available at the time of preparing these estimates. These assumptions and information should properly be documented in a document, entitled “basis of estimate”, for future references.
Conclusion
As noted above, the cost flow diagram and cash flow diagram are among the important elements of financial analysis prior to the commencement of and over the course of a project. The terms cost flow and cash flow are often used interchangeably; however, it is important to identify the purposes that each of these tools intends to serve. A cost flow diagram is a graph that shows expenditures over time. This diagram shows the budgeted amount of money that is needed over time to make progress in accordance with the plans. Cash flow, however, provides a pictorial representation of income over time or the amount and timing of funds that are expected to be allocated to the project.
If you need to prepare cost and cash flow diagram or assess these diagrams to perform financial analysis and make informed decisions, Adroit will be able to assist. For more information, please contact us.
References:
AACE International® (2018). Recommended Practice No. 10S-90 Cost Engineering Terminology. Morgantown, WV: AACE International. Retrieved from http://library.aacei.org/terminology/